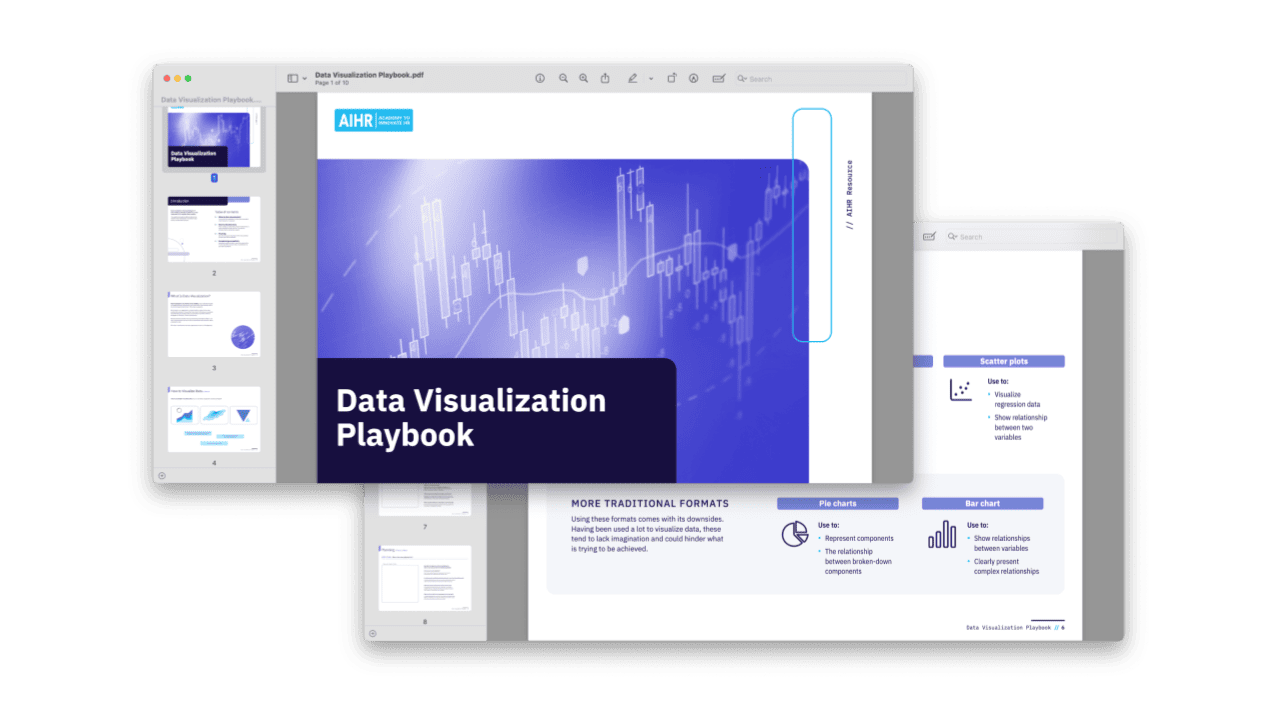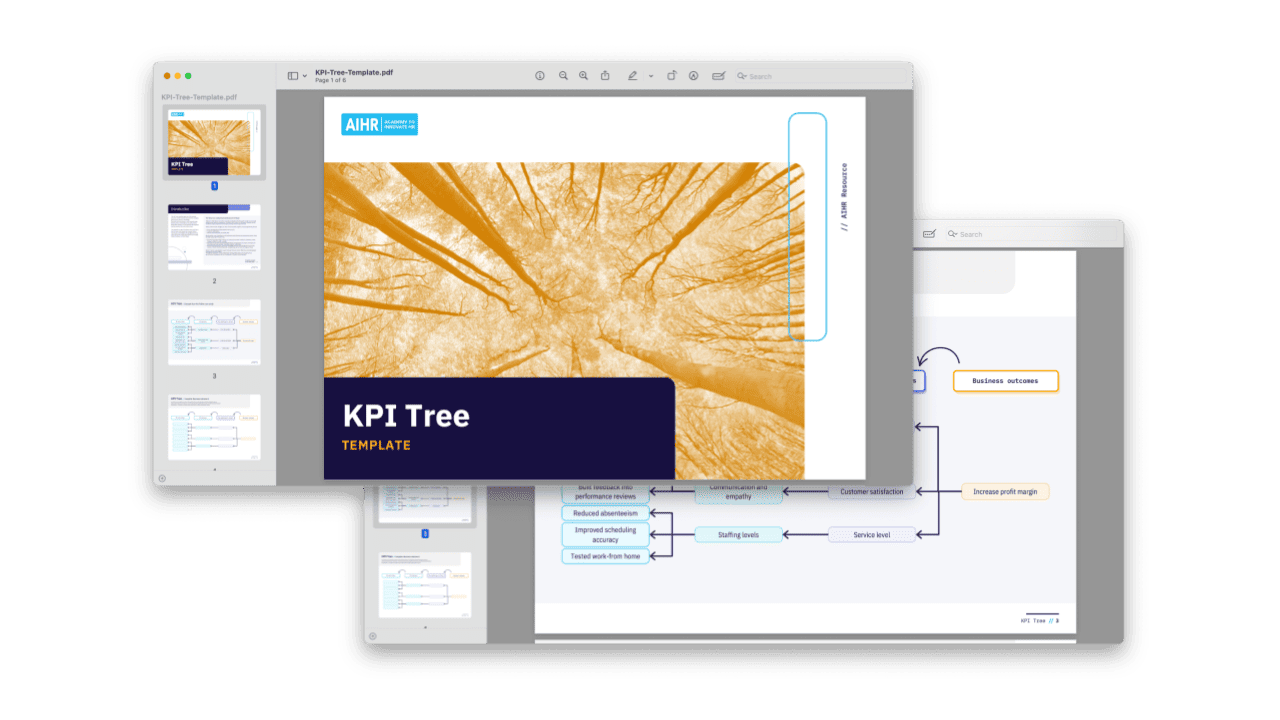

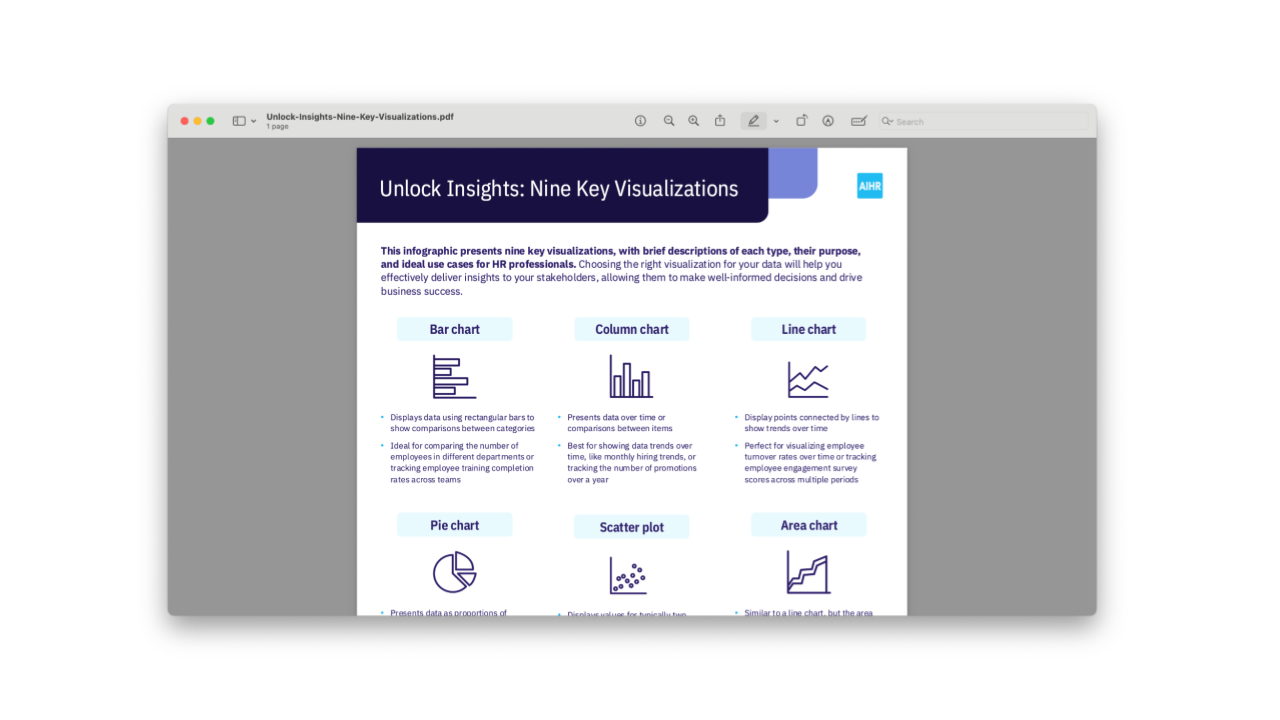

This cheat sheet introduces nine common visual formats and explains when to use each one in HR reporting. It helps HR professionals choose effective ways to present workforce data and communicate insights to stakeholders.
Included in this resource:
- Bar chart
- Column chart
- Line chart
- Pie chart
- Area chart
- Card visualization
- Scatter plot
- Map visualization
- Matrix